Geneva 5 Octobre 1999
ECE/STAT/99/2
Sales of industrial robots are booming in Europe and North America
but plummeting in Japan and Asia
World market fell by 16% in 1998...
Worldwide sales of industrial robots peaked in 1990, when they reached over 81,000 units. Following the recession in 1991-1993, worldwide sales of industrial robots plummeted to about 54,000 units in 1993. The world robot market then started a period with a sharp recovery which peaked in 1997 when it reached a level of 85,000 units. In 1998, however, sales plummeted by over 16% to 71,000 units (see table 1 and figure 1).
... mainly as a result of plummeting sales in Japan and the Republic of Korea
The large drop in sales between 1990 and 1993/1994 was mainly due to the sharp drop in the supply of robots from Japan, from 60,000 units to under 30,000 units in 1994. It is interesting to note that in 1994 the gross supply of robots in Japan was three times as large as the net increase in stock, indicating that as many as 20,000 robots were taken out of operation.
The sharp fall in sales in 1998 was mainly a result of plummeting sales, not only in Japan, but also in the Republic of Korea. Sales in these two countries fell by 21% and by as much as 75%, respectively, as compared to the 1997 level (see table 1 and figure 1).
Table 1
Yearly installations of industrial robots 1997 and 1998
and projections for 1999 and 2002. Number of units
| Country |
1997 |
1998 |
1999 |
2002 |
% change 98/97 |
| Japan |
42,696 |
33,796 |
33,800 |
43,000 |
-20.8 |
| United States |
12,459 |
10,857 |
11,700 |
15,573 |
-12.9 |
| Germany |
9,017 |
9,938 |
10,500 |
13,000 |
10.2 |
| Italy |
3,692 |
4,381 |
4,950 |
6,750 |
18.7 |
| France |
1,721 |
1,653 |
1,950 |
2,650 |
-4 |
| United Kingdom |
1,792 |
1,282 |
1,800 |
2,000 |
-28.5 |
| Big six |
71,377 |
61,907 |
64,700 |
82,973 |
-13.3 |
| Austria |
250 |
250 |
|
|
|
| Benelux |
906 |
959 |
|
|
5.9 |
| Denmark |
130 |
215 |
|
|
65.4 |
| Finland |
220 |
378 |
|
|
71.8 |
| Norway |
67 |
63 |
|
|
-6 |
| Spain |
1,203 |
1,810 |
|
|
50.5 |
| Sweden |
617 |
691 |
|
|
12 |
| Switzerland |
289 |
357 |
|
|
23.5 |
| West-Europe-8 |
3,682 |
4,723 |
5,400 |
7,200 |
28.3 |
| Eastern-Europe |
184 |
206 |
200 |
500 |
12 |
| Australia |
526 |
347 |
|
|
-34 |
| Rep. of Korea |
5,759 |
1,431 |
|
|
-75.2 |
| Singapore |
500 |
500 |
|
|
|
| Taiwan, Province of China |
753 |
759 |
|
|
0.8 |
| Asia-4 |
7,538 |
3,037 |
3,000 |
4,000 |
-59.7 |
| Former USSR |
1,000 |
500 |
1,000 |
1,000 |
-50 |
| Other countries |
1,300 |
800 |
800 |
1,200 |
-38.5 |
| Grand total |
85,081 |
71,173 |
75,100 |
96,873 |
-16.3 |
| Sources: United Nations Economic Commission for Europe (UN/ECE) and |
| International Federation of Robotics (IFR). |
Figure 1
Yearly installations of industrial robots 1993-1998 and projections 1999-2002
Note that Europe and United States apply a more strict definition of industrial robot than Japan.
Sources: United Nations Economic Commission for Europe (UN/ECE) and International Federation of Robotics (IFR).
World market, excluding Japan and the Republic of Korea, is growing fast...
When Japan and the Republic of Korea are excluded, the remaining world market shows an impressive increase of 16% in 1998, compared with 1997. This healthy growth rate should also be seen in the light of growth rates of 21% in 1996 and 35% in 1997 (the corresponding growth rates for total world market were only 11% and 7%, respectively).
United States - a temporary halt in the surge of robot investment in 1998 but skyrocketing sales in the first half of 1999
After three years of yearly growth rates of the order of 30%, the market in the United States fell by 5% in 1996. In 1997, the market was again booming, showing a growth of 28% over 1996, reaching a record 12,500 units. In 1998, however, sales dropped by 13% in terms of units and by 7% in terms of value (see table 1 and figure 1). This was most likely just a temporary setback, since order intake from the American market skyrocketed by 90% in the first half of 1999, compared with 1998.
A steady growth in the European robot market
The European robot market increased by 10% in 1998, to about 22,000 units (see table 1). The order intake in the first half of 1999 increased by 32% over the same period in 1998, indicating that 1999 will see a continued surge in robot investments.
Growth in 1998 was, however, rather unevenly distributed among countries. In the eight smaller western European countries growth was as large as 28% (see table 1). In Spain, Denmark and Finland, growth varied between 50% and over 70%.
Among the larger countries, Germany recorded a growth of 10% and Italy 19%. In France sales dropped by 4%, and by as much as 29% in the United Kingdom. This, however, is not unusual for the United Kingdom, which has for years shown a pattern of surging growth every second year and sharp falls in the years in between.
Asia is a depressing market - for how long?
As was shown above, sales plummeted in Japan and the Republic of Korea. In Singapore, Taiwan Province of China, Thailand and other Asian emerging markets, the previously good conditions for robot investment have come to a halt - at least temporarily (see table 1). In Australia the market fell by 34%.
The value of the world robot market fell 13% in 1998
The value of the 1998 world market was estimated at $4.2 billion, down 13% from 1997. Measured in national currencies, the market fell by 48% in the Republic of Korea (measured in US dollars), 33% in the United Kingdom, 14% in Japan and 7% in the United States. In Germany the market value was flat while it increased by 13% in France and 19% in Italy. It should be noted, however, that the robot units only account for about a third of total robot system costs.
Estimate of the worldwide operational stock of industrial robots:
Total accumulated yearly sales, since industrial robots began to be introduced to industries at the end of the 1960s, amounted at the end of 1998 to some 1,020,000 units. Many of the early robots, however, have by now been taken out of service. The stock of industrial robots in actual operation is therefore lower. ECE and IFR estimate the total worldwide stock of operational industrial robots at the end of 1998 at 720,000 units compared with just under 700,000 units at the end of 1997, representing an increase of 3% over 1997 (see table 2
).
Japan accounts for more than half of the world robot stock. Its share, however, is continuously diminishing. In 1998, the robot stock in Japan actually fell in absolute numbers.
Forecasts - Projected yearly sales of robots revised downwards
Worldwide sales
1998: 71,000 units
2002: 97,000 units,
+8% per year
Worldwide operational stock
1998: 720,000 units
2002: 800,000 units,
+2.7% per year |
The world market for industrial robots is projected to increase from 71,000 units in 1998 to 97,000 in 2002, or by a yearly average of 8% (see table 1 and figure 1). These projections are significantly revised downwards, as compared to those in the previous issue of World Robotics, mainly because of projected stagnation in the Asian markets.
Sales in Japan continue to be sluggish...
Sales in Japan are projected to be flat in 1999 compared with 1998. By 2002, however, sales are projected to have recovered to the 1997 level of 43,000 units (see table 1 and figure 1). In this context it should be noted that a very large share of the new robots supplied will replace older robots taken out of operation. In 1997, for instance, more than two thirds of the Japanese supply were replacement investment. In 1998 more robots were estimated to have been taken out of operation than new robots installed. In late 1980s and early 1990s, before the economic slump occurred in 1992/1993, a large number of robots were installed in Japan. The peak occurred in 1990 with over 60,000 robots installed. At the end of the forecasting period these robots are most likely to be replaced. For this reason higher growth rates are projected for the end of the forecasting period. Despite this, the stock of operational robots is expected to contract continuously.
...but steady growth is projected in Europe and North America
The growth in worldwide robotics is mainly concentrated to North America and Europe (see table 1 and figure 1). Between 1998 and 2002, sales of industrial robots in the United States are projected to increase from 10,900 units to 15,600 units, a total increase of 43%, or by an yearly average increase of just over 9%. In the same period the market in Europe is projected to increase from about 22,000 to about 32,000, an increase of 45%, or a yearly average increase of 10%.
When comparing the data for individual countries, the reader should note that some countries report a much higher share of simple 3-axis robots than other countries. They might also include equipment which, although formally satisfying the definition of industrial robots, is not included in other countries’ statistics, e.g. automatic assembly on printed circuit boards. Table 3 shows the number of installed advanced robots (robots with 5 axes or more) in 1998, compared with the total number of robot installations.
Operational stock of robots continue to show steady increase, except in Japan...
In terms of units, it is estimated that the worldwide stock of operational industrial robots will increase from just over 720,000 units at the end of 1998 to 800,000 at the end of 2002 (see table 2). It is interesting that the operational stock of robots in Japan is projected to decrease from just over 410,000 units in 1998 to just under 370,000 units at the end of 2002. This implies that Japan’s share of the worldwide stock of robots will fall from 57% in 1998 to 46% in 2002. The reason for this is, as was shown above, that the retirement of robots is higher than the new supply.
In the United States, the robot stock is forecasted to reach 120,000 units in 2002. The projection for Germany is 104,000; Italy 47,000; France 20,000; and the United Kingdom 15,000 (see table 2).
In the aggregate of 8 western European countries, the stock is projected to increase from 31,000 units to just under 50,000 units (see table 2). The combined stock of the operational robots of Australia, Republic of Korea, Singapore and Taiwan, Province of China, is projected to increase from 45,000 units to 54,000 units during the forecasting period.
Orders for robots in the first half of 1999 are skyrocketing in North America and Europe
In the first half of 1999, worldwide order intake surged by 36%, compared with the same period in 1998. This figure, however, hides some major differences between regions. While order intake from Europe increased by 32%, it skyrocketed by 90% in North America. In Asia the market was flat.
Looking at order intake by industrial branches, there are also big differences in growth. Orders from the motor vehicle industry, excluding component manufacturing, surged by 101% on a worldwide basis. In North America it skyrocketed by 214%, compared with the same period in 1998. Order intake from component manufactures to the motor vehicle industry and the aggregate "all other industrial branches", on the other hand, each increased by just under 10% in the first half of 1999, compared with the same period in 1998.
Table 2
Estimated operational stock of robots at year end 1990, 1994 and 1998
and projections for 2002. Number of units
| Country |
1990 |
1994 |
1998 |
2002 |
% change 98/97 |
| Japan |
274,200 |
377,000 |
411,800 |
366,600 |
-0.3 |
| United States |
39,000 |
57,100 |
81,700 |
120,200 |
6 |
| Germany |
27,300 |
45,300 |
73,200 |
103,800 |
9.5 |
| Italy |
12,200 |
20,600 |
31,500 |
47,400 |
11 |
| France |
8,400 |
12,300 |
16,200 |
20,000 |
3.7 |
| United Kingdom |
5,900 |
8,100 |
10,800 |
15,000 |
8.1 |
| Big six |
367,000 |
520,500 |
625,200 |
673,000 |
2.3 |
| Austria |
1,100 |
2,100 |
2,800 |
|
5.2 |
| Benelux |
2,300 |
4,500 |
7,200 |
|
11.2 |
| Denmark |
500 |
600 |
1,000 |
|
20.5 |
| Finland |
800 |
1,200 |
1,900 |
|
17.8 |
| Norway |
400 |
500 |
500 |
|
-2.1 |
| Spain |
2,100 |
4,200 |
8,600 |
|
23.4 |
| Sweden |
3,300 |
4,200 |
5,300 |
|
7.1 |
| Switzerland |
1,500 |
2,500 |
3,300 |
|
8.7 |
| West-Europe-8 |
12,200 |
19,700 |
30,700 |
48,700 |
13.2 |
| Eastern Europe |
7,500 |
2,600 |
2,700 |
4,100 |
-1.6 |
| Australia |
1,400 |
1,800 |
2,600 |
|
8.2 |
| Rep. of Korea |
3,000 |
12,700 |
31,400 |
|
4.1 |
| Singapore |
1,400 |
2,300 |
5,000 |
|
7.6 |
| Taiwan P. of C. |
1,300 |
3,300 |
5,800 |
|
13.5 |
| Asia-4 |
7,100 |
20,000 |
44,800 |
53,600 |
5.8 |
| Former USSR |
64,200 |
20,000 |
10,000 |
10,000 |
|
| Other countries |
1,400 |
3,400 |
7,000 |
10,000 |
10.7 |
| Grand total |
459,400 |
586,100 |
720,400 |
799,400 |
3.0 |
Sources: ECE, IFR and national robot associations. |
The robot density is increasing...
Table 4 shows the number of robots per 10,000 persons employed in the manufacturing industry. Four groups of countries can be distinguished: the first group contains Japan, Singapore and the Republic of Korea, with densities ranging from about 280 to 110. These numbers are, however, not directly comparable to those of the other countries because the latter apply a more strict definition of robots.
Among countries applying a more restrictive definition of industrial robots, Germany is in the lead with 100 robots per 10,000 persons employed, followed by Italy and Sweden with about 70. In the third group of countries, the densities vary between 50 and 40.
One robot for every 6 production workers in the motor vehicle industry in Japan...
Table 5 shows another measure of robot density: number of robots per 10,000 production workers in the motor vehicle industry. Here the numbers are 5 to 10 times higher than densities based on all persons employed in the manufacturing industry.
In Japan it is estimated that in 1998 there was one industrial robot for every 6 production workers in the motor vehicle industry. In Italy there were 14 production workers for every robot and 19 in the United States.
Relative prices of robots are falling and their profitability increasing....
Nominal prices of robots are following a falling trend. In addition, when taking into consideration significant improvements in performance, prices of robots relative to labour compensation have fallen even more sharply during the 1990s than nominal prices show. This implies that the profitability of existing robot installations is increasing, while at the same time more and more potential robot applications will satisfy sufficient profitability limits and hence be realized. As the relative prices of robots are projected to continue to fall, and a labour shortage in certain countries remains a possibility, the diffusion of robots might accelerate faster than projected. In the long run (10-15 years) of falling relative prices, labour shortages and quality aspects in production will be further reinforced as the driving forces behind continued high volumes of robotics investments. In the present and previous issues of World Robotics, case studies have given illustration to the above conclusions.
The Postal Service - a new market for robotics
In a guest editorial Mr. Marvin Runyon, Postmaster General and CEO of United States Postal Service describes how his experiences in the U.S. automotive industry, as Vice President with Ford Motor Company and CEO of Nissan Motor Manufacturing Corporation United States, motivated him "to set a new vision for processing mail in the future. The vision was a "lights out" processing concept which focused our resources on developing a network of highly automated processing plants requiring virtually no human labor. These facilities would use existing letter mail automation equipment, integrated with state-of-the art material handling technology, to manage mail flow. In the long-term vision, mail would enter the facility and be virtually untouched by human hands as it was processed to its final destination." With some 760,000 persons
Table 3
Number of robots with 5 axes or more, compared
with total number of robots installed in 1998
| Country |
All robots |
Robots with >= 5 axes |
% share |
| United States |
10,857 |
9,607 |
88.5 |
| Germany |
9,938 |
6,108 |
61.5 |
| Italy |
4,381 |
2,516 |
57.4 |
| Spain |
1,810 |
1,545 |
85.4 |
| France |
1,653 |
1,057 |
63.9 |
| United Kingdom |
1,282 |
871 |
67.9 |
| Benelux |
959 |
671 |
70.0 |
| Sweden |
691 |
616 |
89.1 |
| Australia |
347 |
283 |
81.6 |
| Finland |
378 |
263 |
69.6 |
| Denmark |
215 |
192 |
89.3 |
| Austria |
250 |
130 |
52.0 |
| Taiwan, Province of China |
759 |
108 |
14.2 |
| Norway |
63 |
56 |
88.9 |
| Poland |
53 |
40 |
75.5 |
| Subtotal |
33,636 |
24,063 |
71.5 |
| Japan |
33,796 |
|
|
| Rep. of Korea |
1,431 |
|
|
| Other countries |
2,310 |
|
|
| Grand total |
71,173 |
|
|
Sources: United Nations Economic Commission for Europe (UN/ECE) and International Federation of Robotics (IFR).
Table 4
Number of robots per 10,000 persons employed in the manufacturing industry, 1998
| Country |
1998 |
 |
| Japan |
279 |
| Singapore |
140 |
| Rep. of Korea |
109 |
| Germany |
100 |
| Italy |
70 |
| Sweden |
66 |
| Finland |
48 |
| Benelux |
45 |
| USA |
44 |
| Switzerland |
42 |
| France |
41 |
| Austria |
40 |
| Spain |
34 |
| Australia |
23 |
| UK |
21 |
| Denmark |
20 |
| Norway |
15 |
| Sources: United Nations Economic Commission for Europe (UN/ECE) and International Federation of Robotics (IFR). |
Table 5
Number of robots per 10,000 production workers in the motor vehicle industry, 1993 and 1998
|
1993 |
1998 |
 |
| UK |
175 |
308 |
| Sweden |
317 |
452 |
| USA |
393 |
539 |
| Germany |
313 |
646 |
| Italy |
458 |
705 |
| Japan |
1,481 |
1,655 |
Note: Data for Japan are estimated |
| |
| Sources: United Nations Economic Commission for Europe (UN/ECE) and International Federation of Robotics (IFR). |
employed, there is a large potential for robotics automation in the U.S. Postal Service. After a very successful test period, with an expected return of investment in excess of 20%, hundreds of robots have been ordered. Mr. Runyon once predicted that in 20 years the Postal Service would have 80,000 robots, just to illustrate the potential for robotics use in this branch.
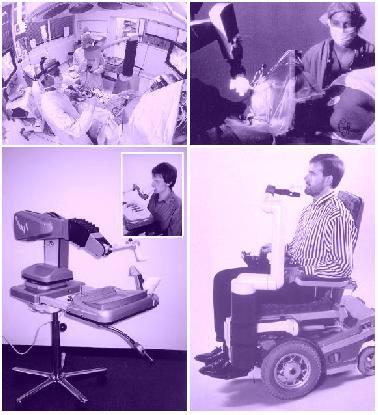
Worldwide diffusion of service robots
A service robot is a robot which operates semi or fully autonomously to perform services
useful to the well being of humans and equipment, excluding manufacturing operations
With this definition, manipulating industrial robots could also be regarded as service robots, provided they are installed in non-manufacturing operations. Service robots may or may not be equipped with an arm structure, as are industrial robots. Often, but not always, service robots are mobile. In some cases, service robots consist of a mobile platform on which one or several arms are attached and controlled in the same mode as the arms of the industrial robot. The different types of service robots are illustrated by photos.
There are many difficulties in collecting reliable statistics on service robots. However, based on a survey carried out by ECE and IFR, the total world stock of service robots at the end of 1998 can be estimated at a minimum of about 5,000 units (see table 6). When, for instance, cleaning robots and lawn mowing robots have reached such a level of cost-effectiveness that they can be affordable not only for professional use but also for households, where the degree of utilization can be counted in only a few hours per day, then the market for service robots could rapidly take off. Other important growth areas for service robots are household robots, robots for handicapped and disabled persons, and, above all, robots in the medical field used and designed for robot-assisted surgery.
In the period 1999-2002, it is projected that almost 24,000 service robots will be installed and possibly also as many as close to half a million vacuum cleaning robots (see table 6). The figures above do not take into account sales of low-end entertainment robots which might be estimated at several hundred thousand.
The present publication reviews in more detail the state-of-the-art applications listed in table 6. Some of the applications listed in table 6 are also illustrated in figure 2.
Taking a longer-term perspective, say 10-15 years from now, domestic service robots can very well have entered into a diffusion process similar to that which the PC, the mobile telephone or the Internet have had in recent years. In fact, the wide usage of the latter type of equipment greatly facilitates the introduction of service robots. Today or in the next few years almost all homes in western Europe will have PCs, mobile phones and Internet connections. The acceptability of "digital knowledge," or at least familiarity with it, in particular among young and middle-aged persons, will smooth the transition of robots into our homes.
Increasingly, various types of tools and equipment in our homes (heating systems, fire and burglary alarm, stove, oven, refrigerators etc.) will incorporate microcomputers and, above all, will be able to communicate with each other, either by cable, electricity wiring or by infrared or other wireless modes of communication. We will be able to control them remotely, using mobile phones as terminals. In this environment, domestic robots will serve as an important link between the various types of computer-controlled equipment and systems in our "wired" homes.
Table 6
Estimated number of service robots installed up to the end of 1998, by application areas,
and forecasts for the period 1999-2002
| Types of robots |
Stock at end 1998 |
Installations 1999-2002 |
| Cleaning robots |
300 |
500 |
| -Floor cleaning |
| -Tank cleaning |
| -Window cleaning; wall cleaning |
| -Other (Aircraft cleaning) |
| Sewer robots (cleaning, inspection) |
200 |
200 |
| Wall-climbing robots (cleaning, inspection) |
| Inspection robots, general (power plants, nuclear sites, bridges, etc. |
| Underwater robots |
400 |
200 |
| -Inspection |
| -Work class robots |
| Domestic robots |
2,000 |
12,500 |
| -Vacuum cleaning |
| -Lawn mowing |
| -Other |
| Medical robots |
800 |
7,000 |
| -Surgical robots |
| -Robot-assisted surgery |
| -Other |
| Robots for disabled persons; Assistive robots; Wheelchair robots |
200 |
200 |
| Courier robots; Mail delivery robots |
100 |
200 |
| Mobile robot platforms (multiple use) |
400 |
200 |
| Surveillance robots; Security robots |
50 |
300 |
| Guide robots (e.g. in museums) |
|
100 |
| Refuelling robots |
50 |
800 |
| Fire and bomb fighting robots |
150 |
400 |
| Robots in the construction industry |
350 |
1,000 |
| Robots in agriculture and forestry |
| Hotel and restaurant robots |
| Clean-room robots |
| Laboratory robots |
| Space robots |
| Entertainment robots |
| Other types |
| Total number of units, excluding vacuum cleaning robots |
5,000 |
23,600 |
| Vacuum cleaning robots |
|
450,000 |
| Estimated value in $ millions |
600 |
3,300 |
Sources: ECE and IFR.
With the above described complementary technology in place and with improved performance of domestic robots at a lower price (i.e. following a similar curve of price/performance ratio as other electronic goods), a potentially huge market is opening up. Modular designed robot platforms - to which various types of utilities, e.g. for vacuum and other types of cleaning, can be attached as well as articulated robot arms, various types of sensors and vision systems - could carry out a variety of tasks in our homes. They could vacuum clean, scrub floors, empty the dishwasher and place the china in the cupboards, lay the table, take out the garbage, open doors, guard the house against fire and intruders, mow the lawn, increase the mobility and security of old and disabled persons, and much more. Increased functional flexibility will allow one robot system to free us from a number of routine jobs.
How much do we value our leisure time? It is reasonable to assume that it is a function of our hourly income, and the amount of leisure time left after having carried out professional work and necessary household tasks. If the time saved through using domestic robots is used for paid work, then it is easy to relate a value to the freed time and, from that, to attach an income to the domestic robots. For high income people there will thus be strong incentives to use domestic robots.
*
* *
The publication World Robotics 1999 - Statistics, Market Analysis, Forecasts, Case Studies and Profitability of Robot Investment is available, quoting Sales No. GV.E.99.0.24 or ISBN No. 92-1-101007-1, through the usual United Nations sales agents in various countries or from the United Nations Office at Geneva (see address below), priced at US$ 120:
United Nations
Palais des Nations
CH - 1211 Geneva 10, Switzerland
Phone:(+41 22) 917 26 06 / 26 12 / 26 13
Fax:(+41 22) 917 00 27
E-mail:[email protected] ;
For more information about the publication, please contact:
Mr. Jan Karlsson
Statistical Division
United Nations Economic Commission
for Europe (UN/ECE)
CH - 1211 Geneva 10, Switzerland
Phone:(+41 22) 917 32 85
Fax:(+41 22) 917 00 40
E-mail:[email protected]
or
International Federation of
Robotics (IFR)
Box 5506
S - 114 85 Stockholm
Sweden
Phone:(+ 46 8) 782 08 43
Fax:(+ 46 8) 660 33 78
E-mail:[email protected]
Figure 2a
Examples of service robots: Underwater robots; Wall-climbing robots;
Fire- and bomb-fighting robots; Robots for handling nuclear material
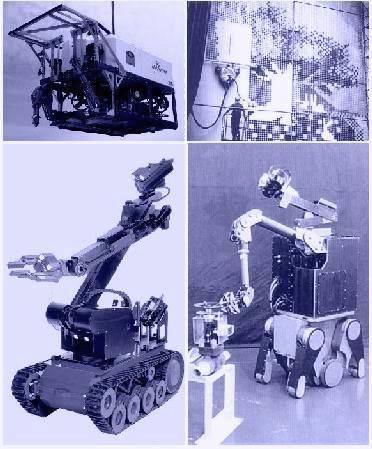
Figure 2b
Examples of service robots: Vacuum cleaning robots for domestic use: Battery and solar-powered lawn mowing robots
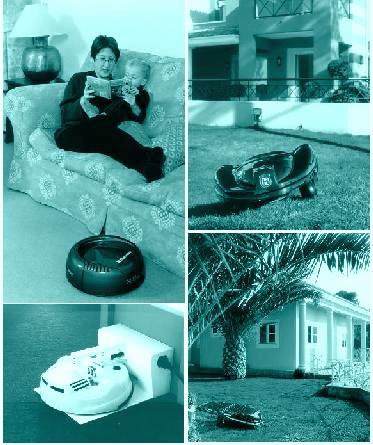
Figure 2c
Examples of service robots: Surgical robots and robot-assisted surgery; Robots for disabled persons